These are real client engagements, dips included. Search results rarely move in a straight line. AI Overviews, Google algorithm updates and website rebuilds all cause swings, so each case study below shows what went up, what went down, and why. We keep client names private, name the industry, and say exactly what each number measures.
- Data sources: Google Search Console (clicks, impressions, rankings), Google Analytics 4 (traffic, leads, revenue), an AI visibility tracking platform (how often AI tools mention a brand) and, for lead quality, the client’s own lead records.
- Clicks are visits from Google search results. Impressions are how many times a page appeared in results. Top 10 means the first page of Google.
- Every comparison names its time window, such as “Jul 2 to Sep 29, 2026 vs. the prior 90 days.”
- Status labels: “Results” means the outcome is measured. “Findings” means we are sharing what an analysis found, before outcomes are measured.
Client Case Studies
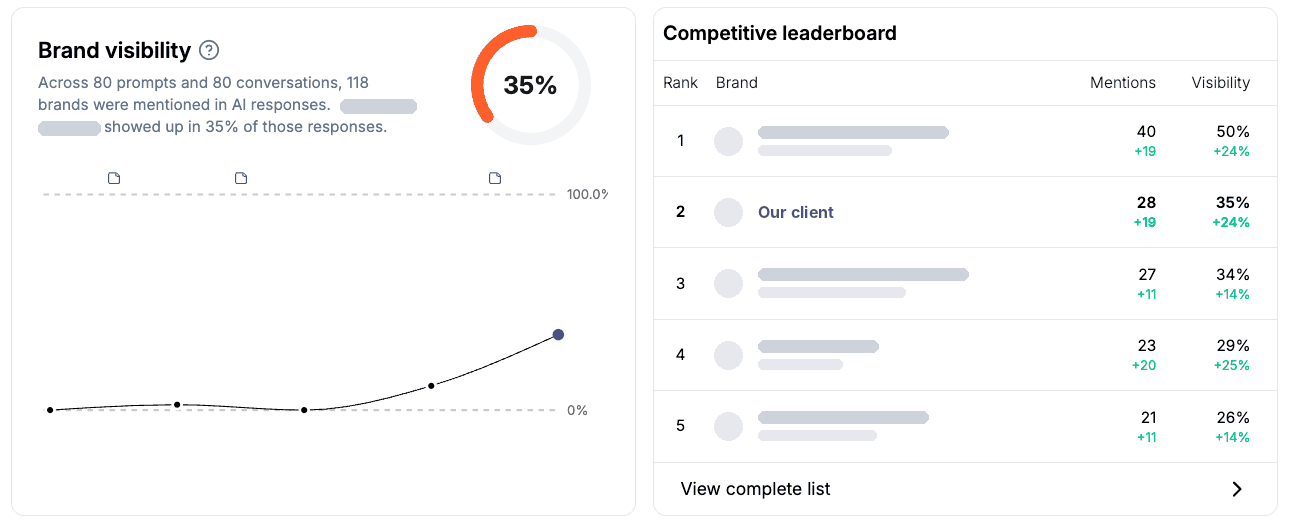
From 0% to the #2 Brand in AI Answers
The client: A travel company that plans trips for its clients. Many travelers ask ChatGPT and other AI assistants to help plan a trip, and at the start the client appeared in 0% of those AI answers.
What we did:
- Tracked the prompts that matter. We set up AI visibility tracking for 80 trip-planning prompts to see when AI assistants mention the client and when they mention competitors.
- Built an FAQ page. We added an FAQ page that answers common traveler questions. It lifted AI visibility from 0% to 11%.
- Revamped the itinerary pages. We found the prompts where the client had little or no visibility, then revamped the itinerary pages around them with much more detail and far tighter prompt targeting.
What happened: After the itinerary revamp, the client showed up in 35% of AI answers and became the #2 most-mentioned brand out of 118, up from #8.
Why it pays off: The client’s best page for lead quality is an itinerary page. In our 2026 lead analysis, 88% of its leads were graded high quality.
AI Search Became a Real Revenue Channel
The client: A national eCommerce brand. Many of its customers research products in ChatGPT and other AI tools before they buy.
What we did: In the months before these results, we did technical SEO and GEO work and optimized the site’s existing content, which positioned it for this growth. We also set up monthly AI visibility tracking for 80 buyer questions across 8 customer types, split AI traffic and revenue by AI tool in GA4, and found which pages AI tools cite and send buyers to. Our analysis became a 30-item plan of new and improved pages.
What happened: From July 2 to September 29, 2026, visitors from AI tools brought in far more revenue than in the prior 90 days. These results came from our earlier technical and content work, before any of the new pages in the 30-item plan were built.
View the data as a table
| Metric | Apr 3 to Jul 1 | Jul 2 to Sep 29 | Change |
|---|---|---|---|
| AI-referred revenue | $3.0K | $21.0K | about 7x |
| Revenue per ChatGPT visit | $1.05 | $6.33 | +503% |
| ChatGPT Shopping revenue | $940 | $4,211 | about 4.5x |
| ChatGPT Shopping visits | 175 | 491 | +181% |
| Visits from AI tools | 2,856 | 3,148 | +10% |
- A small set of product pages brings in about half of the AI revenue, so results can swing from month to month.
- Growth came almost entirely from ChatGPT. Smaller AI tools like Perplexity and Copilot sent fewer visits.
- The brand is named in 76 of 80 tracked AI answers, but competitors that publish pricing and comparison details are sometimes named first. The 30-item plan is built to close that gap.
The plan: New pages for cost and head-to-head comparisons, built to earn the #1 recommendation more often.
Separating AI Overview Losses From a Site Rebuild
The client: An online retailer. Its website was rebuilt on a new platform in April 2026, before we were involved, and organic search traffic dropped afterward.
What we did: We joined in August 2026. We separated how much of the drop came from AI Overviews versus the rebuild, then audited indexing, page structure, schema and the pages that lost the most.
View the data as a table
| Period | Clicks per week | Note |
|---|---|---|
| Spring 2025 (Apr to May) | about 2,490 | Prior high |
| 6 weeks before the rebuild (to Apr 12, 2026) | about 1,980 | Already about 20% below the prior year |
| Low point (week of Jun 28, 2026) | 1,134 | 43% below the pre-rebuild level |
| Late Jul to early Aug 2026 | about 1,425 | 26% above the low point |
What the data shows:
- About half of the year-over-year drop started before the rebuild. Clicks were already about 20% below the year before, the same AI Overview trend we see across many retailers.
- Clicks fell about 43% below the pre-rebuild level at the worst point. Category pages accounted for most of the lost clicks.
- Recovery had started before we joined. The client’s July fixes brought clicks back 26% from the low point.
- The biggest technical issue: On 3,528 pages (88% of everything Google left out of its index), Google ignored the URL the site had chosen.
Recommended fixes: correcting how Google picks the main version of each page, rebuilding the category pages around what shoppers search for, adding review schema, and creating or updating content to target true content gaps for Google keywords and AI search prompts.
On a free 30-minute call, we’ll look at your goals and whether we’re a good fit.
Our Research: What AI Search Actually Cites
In 2026 we studied 1,044 AI answers, mostly from ChatGPT, from 13 client tracking programs across 8 industries. Those answers included 4,872 brand recommendations and 5,376 cited sources. Three findings shape how we work:
- Company websites are the main source. 84% of the sources AI tools cited were company websites, not news sites, forums or directories.
- Getting cited and getting recommended go together. When an answer cited a brand’s own website, it recommended that brand 96% of the time. When it didn’t cite the brand’s site, it recommended the brand only 18% of the time.
- Commercial pages get cited, blog posts rarely do. Only 6.9% of citations went to blog posts. Homepages, service, About and product pages earned far more.
Read the full AI search citation study ›
Earlier Results (Before AI Search)
Highlights from earlier SEO work, before AI Overviews, including Dan’s work before he founded Kern Media®:
How We Report Results
- We show the dips. AI Overviews, core updates and site migrations cause real swings. We explain them instead of hiding them.
- We use first-party data. Google Search Console and GA4 first. Ahrefs is used for keyword data, never for traffic estimates.
- We tie work to business outcomes. Leads, revenue and lead quality, as well as rankings.
- We track AI visibility separately. Each AI tool behaves differently, so we measure them one by one.
Want to Know Where You Stand in Google and AI Search?
You’ll talk directly with founder Dan Kern, not a salesperson, and get a custom proposal after the call.
See our services and FAQs, pricing or our company facts page.


